Farsight Security, Inc., USA
Copyright © 2018 Virus Bulletin
Domain names are normatively registered for one or more years, and faithfully renewed thereafter. Domains slated for abusive uses, however, are effectively disposable: they are registered, quickly abused for cybercrime, and abandoned. In this study, we monitor an ongoing data feed of newly observed domains (NOD) to generate a cohort data set, and periodically probe those names to determine what fraction of new domains get suspended by their registrar, deleted by the DNS provider, or effectively ‘killed’ by several well-known blocklists. We then analyse how quickly this happens, the most likely cause of domain ‘death’, and how this may vary depending on the TLD involved. The study provides the first systematic study of domain lifetimes, unravelling their complexities and showing the impact of blocklists on the new gTLDs. The results can be used to deploy more secure DNS policy rules in a computer network.
The DNS industry lacks a complete, systematic study on what happens to domains once they have been registered, delegated, and used for the first time. One popular assertion is that most new domain names are malicious [1]. Several commercial and academic studies have addressed similar problems [2, 3, 4], but in this paper we combine a real-time stream of passive DNS observations with active DNS measurements, which we believe provides a much more comprehensive view of the life cycle of DNS names.
In this study, we uncover the first seven days of life of 23.8M domains under 936 TLDs, measured over the course of six months from a global Internet perspective. We analyse differences among TLDs and various causes of new domain deaths.
We begin our paper by explaining our measurement methodology in Section 2. Then, Section 3 analyses and visualizes obtained results. We conclude in Section 4 by summarizing our research and providing the industry with a recommendation for improving DNS security.
Our measurement system consists of four stages:
The general method is to check repeatedly, at increasing time intervals, for each domain: does it still exist in the DNS? Is it still not listed in the blocklists we are checking? We describe this process in more detail in the following subsections.
NOD is a streaming data service provided by Farsight Security, which operates a global network of passive DNS sensors [5]. The sensors collect DNS cache miss traffic from above recursive resolvers, i.e. they record communication with authoritative nameservers. The collected data is processed and stored in DNSDB, a historical DNS database, as detailed in [6].
When a domain that has not yet been seen in DNSDB is observed, a message is emitted on NOD, notifying listeners of the detection of the first use of a new domain on the Internet. Note that this does not imply detection of newly registered domains, as a domain can stay dormant for months after registration – instead, NOD detects the moment of first query for a domain on the Internet. Also note that NOD detects effective second-level domains (SLDs), i.e. new labels directly under the IANA-accredited TLDs, e.g. example.com, and under the de facto TLDs tracked in the Public Suffix List by Mozilla [7], e.g. example.co.uk.
As of Q1 2018, on average, more than two new SLDs are detected on the Internet each second. For comparison, if we consider Fully Qualified Domain Names (FQDNs, e.g. ns1.example.co.uk), more than 150 new FQDNs are detected on the Internet each second using the Newly Observed Hosts (NOH), another channel provided by Farsight Security.
Finally, note there are wildcard TLDs in the DNS – for instance, each query for any domain under *.pw or *.ws will succeed and return the same result. We ignore such TLDs to avoid tracking names in essentially random queries that should normally return an error.
The next stage listens to NOD and schedules a series of active probes for each new domain. We track each domain directly at three locations of the DNS hierarchy:
We query these three locations repeatedly over the course of seven days, using 20 repetitions with increasing time pauses:
The final 20th set of queries is executed at exactly 629,760 seconds, which equals seven days, six hours and 56 minutes since the domain was detected.
The scheduled DNS queries are run via a pool of workers distributed globally in North America, Europe and Asia. For each query repetition for a particular domain, a worker is chosen at random, i.e. the queries are run around the world, each time from a different location.
For tracking delegators and authoritative nameservers, we send non-recursive DNS queries from workers directly to respective server IP addresses found in the previous stage. For tracking blocklists, we issue recursive DNS queries using a local instance of the unbound resolver [11]. In every case, we repeat the query three times in case of no reply. All DNS replies are encoded in the dnstap format [12] and sent to a centralized location for further processing.
The last step is the parsing of a stream of real-time dnstap data: we extract the fields identity and extra, and from message we extract response_time_sec and query_zone. Finally, we parse response_message as a wire-format DNS response message and extract the DNS rcode.
Thus, our basic data point is a tuple of (identity, extra, response_time_sec, query_zone, rcode), where identity is the worker that ran the query, extra encodes one of the three locations described in ‘stage 2’, response_time_sec gives us the time when the response arrived, query_zone is the domain name, and rcode tells us the DNS response code.
The tuples are stored in an SQLite database [13], with one record per domain, in a table with the SQL schema presented in Listing 1.
CREATE TABLE nod(
    'id' integer primary key autoincrement,
    'domain' text,     -- the domain
    'observed' int,     -- when the domain was observed
    'scheduled' int,    -- when the domain was scheduled for measurements
    'delegator' text,   -- delegator: ip/name/bailiwick
    'deleg_count' int,  -- delegator: number of DNS responses so far
    'deleg_last' int,     -- delegator: timestamp of last DNS response
    'deleg_rcode' int,  -- delegator: rcode of last DNS response
    'deleg_nxd' int,     -- delegator: timestamp of first rcode=NXDOMAIN
    'authority' text,     -- auth NS: ip/name/bailiwick
    'auth_count' int,    -- auth NS: number of DNS responses so far
    'auth_last' int,       -- auth NS: timestamp of last DNS response
    'auth_rcode' int,    -- auth NS: rcode of last DNS response
    'auth_nxd' int,      -- auth NS: timestamp of first rcode=NXDOMAIN
    'dnsbl_count' int,   -- DNSBL: number of DNS responses so far
    'dnsbl_last' int,      -- DNSBL: timestamp of last DNS response
    'dnsbl_rcode' int,    -- DNSBL: rcode of last DNS response
    'dnsbl_listed' int,    -- DNSBL: timestamp of first rcode=SUCCESS
    'dnsbl_detail' text   -- DNSBL: the provider behind dnsbl_listed
);
Listing 1: SQL schema used for data storage.
We consider a domain effectively dead if any of the following happens:
If more than one of the above happens, we treat the first event as the cause of death. If a domain dies, we do not cancel the scheduled measurements for it, but it cannot go back to the ‘alive’ status, e.g. if the delegator starts replying with SUCCESS rcodes again. Also, note that we always retry DNS queries that fail with SERVFAIL or other rcode, except for REFUSED.
For performance reasons, the records are periodically removed from the database and archived in daily CSV files, after the measurements are finished for a particular domain. The archival process interprets the records by prepending three columns to each record: 1) TLD, which gives the effective TLD of the domain; 2) status, which is either ‘alive’ or ‘dead-<cause>’; and 3) lifetime, which for dead domains gives the time since appearance in NOD to the cause of death event. These additional columns make data aggregations easier.
We ran our measurements for six months, from December 2017 until the end of May 2018, which yielded raw data on 24.9M new domains. Out of these, we had to drop incomplete data on 1.1M domains, due to our data collection system being temporarily unavailable during measurements. Thus, in total, we used a dataset on 23.8M new domains for the study.
| Rank | TLD | Count | % of NOD |
| 1 | com | 6,930,000 | 29.1% |
| 2 | net | 955,000 | 4.0% |
| 3 | cn | 900,000 | 3.8% |
| 4 | tk | 785,000 | 3.3% |
| 5 | top | 616,000 | 2.6% |
| 6 | loan | 559,000 | 2.3% |
| 7 | org | 556,000 | 2.3% |
| 8 | ga | 531,000 | 2.2% |
| 9 | ml | 498,000 | 2.1% |
| 10 | cf | 495,000 | 2.1% |
| 12,825,000 | 53.9% |
Table 1: Top 10 TLDs of newly observed domains.
Considering TLD types, 43.7% of the domains were registered under one of 226 ccTLDs (country code TLDs, e.g. .de), 35.5% belonged to one of six legacy gTLDs (generic TLDs, e.g. .com), and 20.4% were under one of 607 new gTLDs (recently introduced gTLDs like .xyz). The remaining <1% belonged to one of 85 internationalized TLDs or 12 sponsored TLDs.
If we consider specific TLDs instead of their types, almost one third of all domains were registered under .com. All other TLDs were roughly at least an order of magnitude less popular, as visible in Table 1. Thus, note that TLDs differ considerably in their rates of new domains, and therefore in their impact on the DNS.
In Figure 1, we present the number of new domains observed each day. By the time we plot the data, we already know the ultimate state of each domain, so the black vs. grey colour is used to show the proportion of domains that ‘survived’ vs. those that ‘died’. Out of 23.8M evaluated domains, 21.6M (90.7%) survived, while 2.2M (9.3%) did not. This rate of ‘bad’ domains was lower than we anticipated, having expected to find that ‘most new domains are malicious’ [1].
The death rate was rather constant and roughly followed a normal distribution, with standard deviation of 1.9%. The number of domains evaluated each day varied due to NOD, but on average we saw 155K per day.
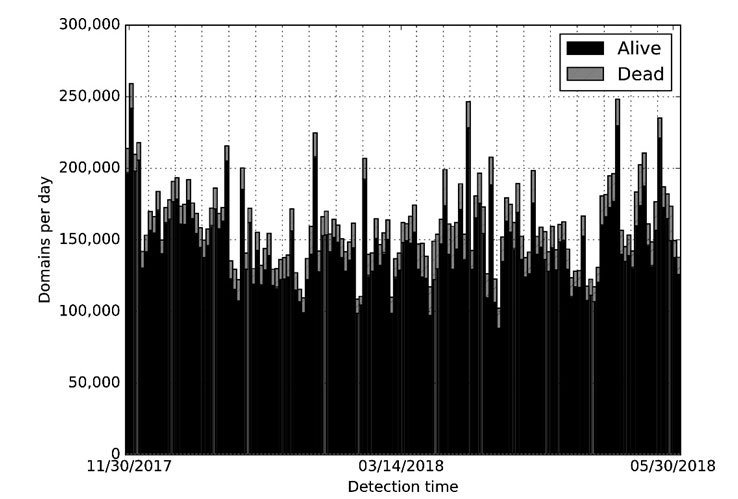 Figure 1: Number of new domains detected per day, with their state after seven days.
In Figure 2, we analyse the 2.2M dead domains to see how quickly they died. The plot is a histogram, where each bin represents one of the 20 DNS probes we send for each domain. Note that while the time gaps between the DNS probes are not constant (they grow as described in Section 2), we draw the bars equidistantly to make interpretation easier. The bar labels give the upper time limits, e.g. ‘17m’ below the first bar means that it represents the queries that finished in under 17 minutes since a domain was observed; the next bar, labelled ‘51m’, represents queries that finished between the 17th and 51st minute, etc. On the vertical axis, we give the death likelihood, i.e. the plot shows empirical probability distribution of the death event among new domains that will eventually die before the end of their first seven days of life.
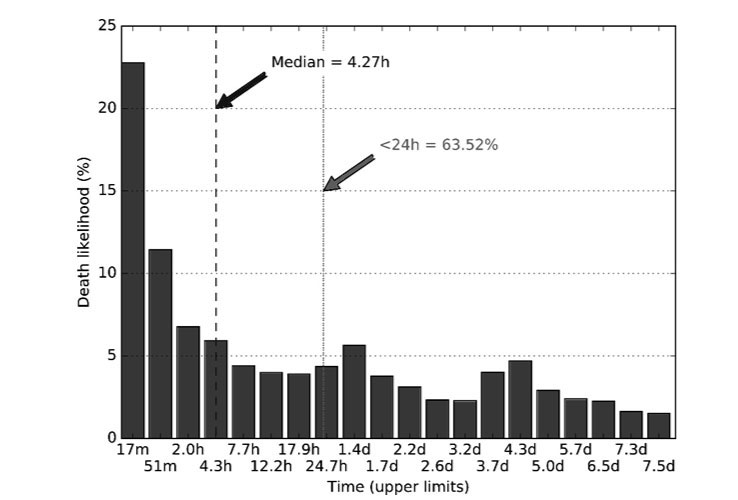 Figure 2: Death likelihood versus domain age.
Surprisingly, the median longevity marked on the plot with a dashed line is just 4.27h, i.e. four hours and 16 minutes. In other words, if a new domain is going to die in less than a week, most likely it will die really quickly: in just a few hours, or even just a dozen minutes. Apart from that observation, we identified three peaks in the data – roughly 1h, 1.5d, and 4d – which seem to be the three modes in mortality of new domains. Finally, note that although ~63% of domain deaths happen in less than 24h, a non-trivial number of deaths (~37%) will happen in the following days after a domain is used for the first time.
Figure 3 presents the causes of new domain deaths. The horizontal axis gives time, and the vertical axis gives cumulative number of deaths, as a percentage of all new domains, in order to better explain the net effect of 9.3% dead domains we reported in the previous subsection. Note that blacklisting is clearly dominant, being responsible for 6.7% deaths of new domains, which is especially visible for the first two days of domain life. Next, we see 2.5% deaths due to action by the registrars: action that is important, but which needs time to take place. Finally, only 0.2% of new domain deaths were due to the party responsible for DNS hosting, which was expected. It is easiest for the bad actor to control this risk by running their own dedicated nameservers, although this may increase their risk of being readily identified en masse via passive DNS methods.
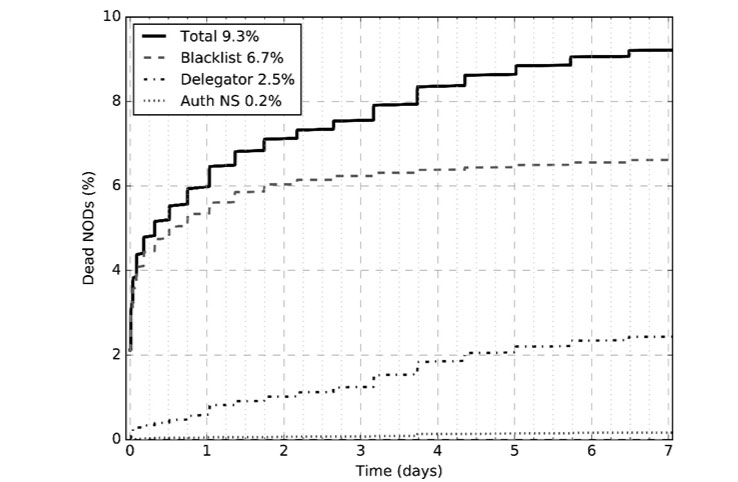
Figure 3: Causes of new domain deaths and their timing.
Note that we consider only the first cause of death for our study, which means the percentages we show in Figure 3 are influenced by how quickly a certain party can effectively kill a domain. For that reason, in Figure 4 we analyse the intersections between various death events when considered independently of each other. That is, we check how often a new domain will experience one, two, or all of the three death events we described in Section 2. Surprisingly, these events seem complementary, with the biggest overlap of 4.0% for a new domain being both blacklisted and deleted at the TLD level.
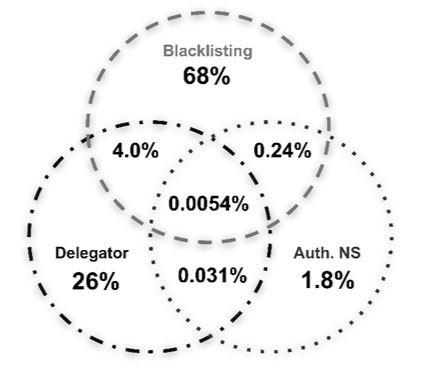 Figure 4: Intersection of independent causes of death (the diagram is not to scale).
Let us analyse the timing of each ‘cause of death’ in more detail. Figures 5, 6 and 7 present the death likelihood separately for each cause, which clearly shows considerable differences, and explain the sources of the peaks in data we saw in Figure 2.
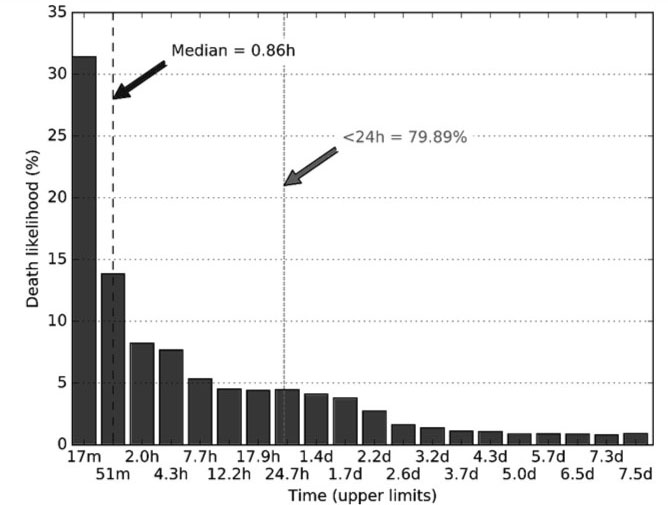 Figure 5: Deaths due to DNS blacklists: likelihood vs. domain age.
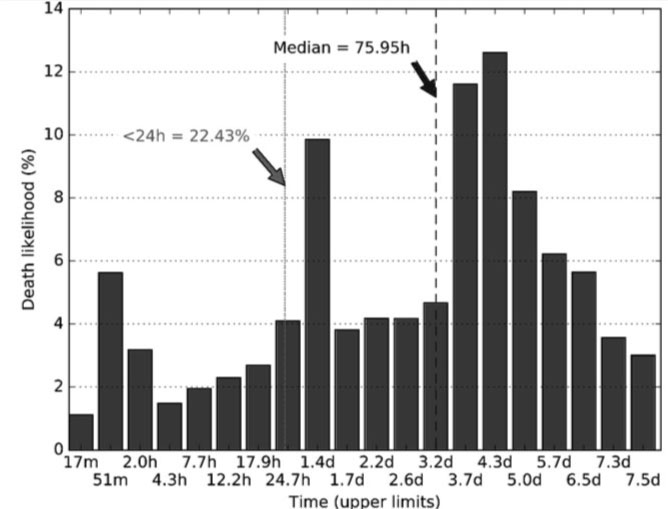 Figure 6: Deaths due to delegators: likelihood vs. domain age.
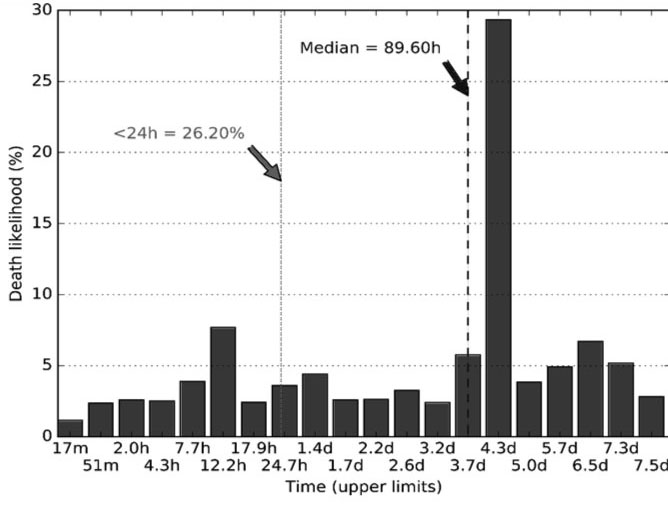 Figure 7: Deaths due to authoritative nameservers: likelihood vs. domain age.
From Figure 5, it is apparent that blacklists kill new domains fast, in under an hour, and that the histogram resembles an exponential distribution. The histogram for delegators presented in Figure 6 has a completely different probability distribution, with peaks around 1h, 1.5d and 4d, which we speculate is an artifact of automated procedures for domain deletion. Also, note that the median time of delegator action is three days and four hours (76h).
In Figure 7, authoritative nameservers basically show a huge peak at around four days, which we found to be caused by seemingly random domains under the .to TLD. If we ignore this TLD, the death likelihood is much more uniform.
Finally, let us see if the probability that a new domain will die quickly depends on the TLD. In Figure 8, we see that domains under the new gTLDs are on average roughly three times as likely to experience early deletion as domains under the legacy gTLDs. There is a considerable difference in the causes of death: for the new gTLDs, the major cause of death is blacklisting, whereas for the legacy TLDs, it is the registrar action. Note that we are considering the averages for all TLDs in a group, which means that specific TLDs can exhibit more extreme characteristics, as will be presented below. Also, note that the IDN and sponsored TLDs experience relatively low rates of early deletion compared with the more popular TLD types.
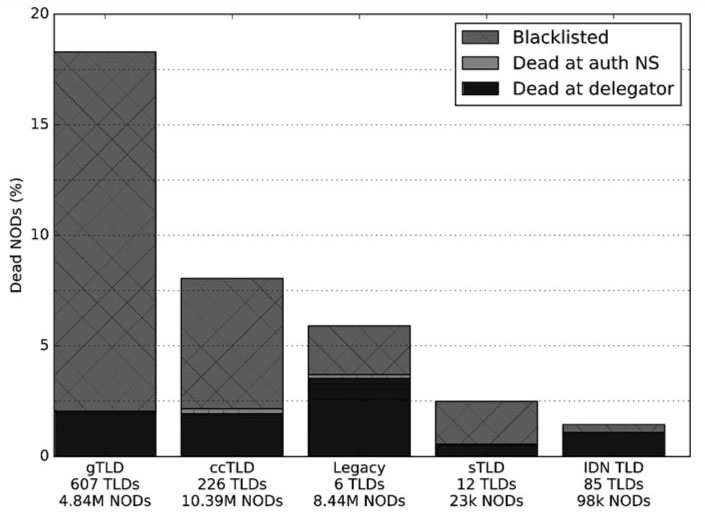 Figure 8: Impact of TLD group on new domain death rate.
In Figure 9, we present the top 25 new gTLDs that have the highest new domain death rates. We skip the gTLDs with low impact by considering only those with more than 5K domains in our dataset, i.e. roughly more than one new domain detected per hour.
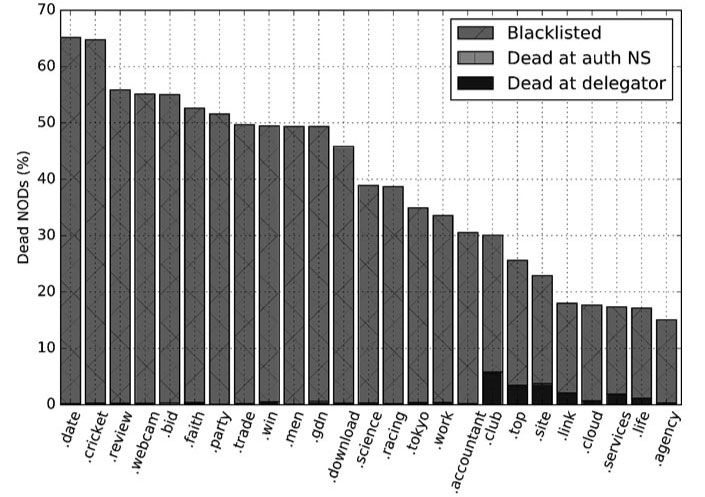 Figure 9: New gTLDs with the highest new domain death rates.
We found many gTLDs with high new domain death rates, for example .date and .cricket, with >65% death rates. Almost all of those domain deaths were due to blacklisting, with little impact of the delegator.
In Figure 10, we analyse the causes of death for two illustrative gTLDs, .top and .xyz. We see that one in four .top domains die quickly, mainly due to blacklisting, and that the registrar does not take much action until the third day after the domain is observed. On the other hand, for .xyz we see that the registrar deletes almost twice as many of its domains as blacklists do, and that the majority of these deletions happen on either the first or the fifth day of the domain life, which suggests automated procedures.
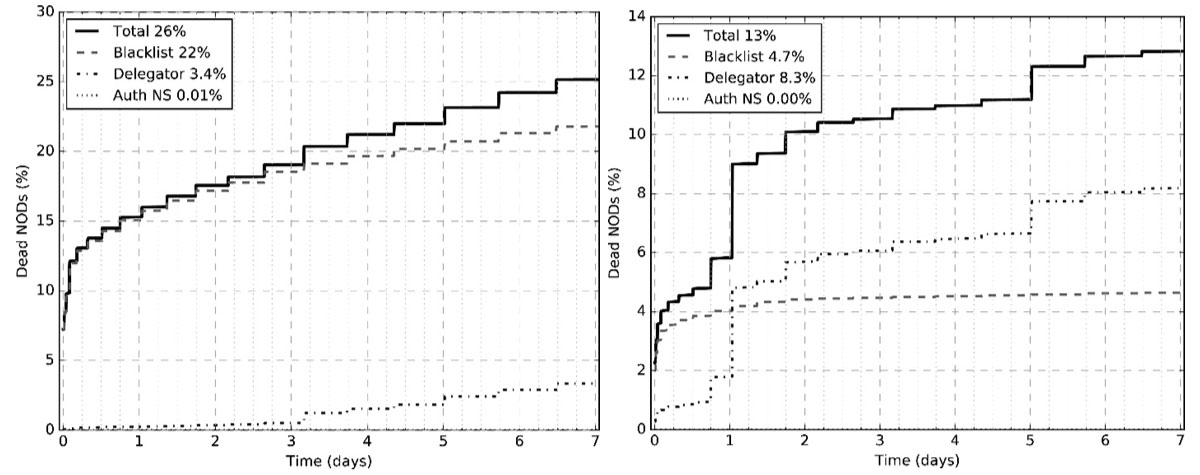 Figure 10: Causes of death for two gTLDs: .top (left) and .xyz (right).
We conclude that the new gTLDs are highly susceptible to abuse. Many gTLDs cost less than $1 to register, which makes them easily available for cybercrime [14]. Such a low price means low profits to the registrar, and in consequence little budget available for mitigating domain abuse [15].
Figure 11 demonstrates that some ccTLDs are abused and experience high new domain death rates. The TLDs managed by Freenom – .gq, .ml, .cf, .ga, and .tk – experience the highest death rate of 18.7% on average. Note that, if considered together, they are the world’s second most popular source of new domains (total 11.6%, see Table 1). Those TLDs offer free domains, but unfortunately their abuse may damage the reputation of all domains under such a TLD. Surprisingly, one of the top TLDs in this plot is .eu, which is connected with the European Union. We speculate that the reason for this is that it is cheap, people generally trust it, and for a long time it had no domain whois. Note there is a clear gap in the death rates among ccTLDs. The ones being used for their original purpose – as a TLD for use by citizens or nationals of that country – experience new domain death rates below 5%. The two notable exceptions are .cn and .us, with death rates of 18.5% and 7.7%, respectively.
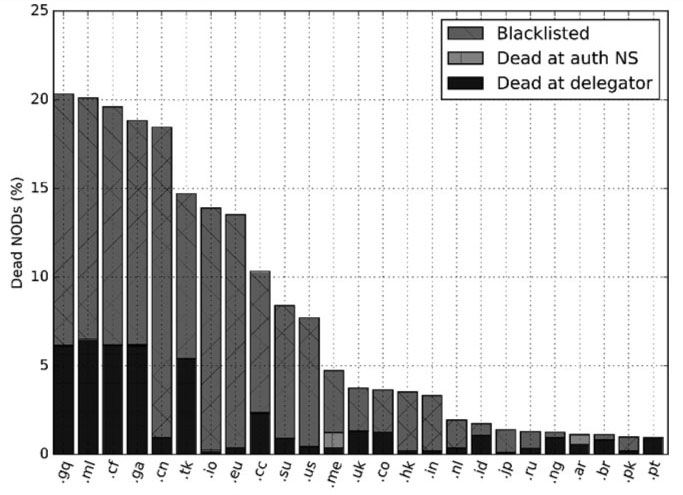 Figure 11: Country-code TLDs with the highest new domain death rates.
In Figure 12, we analyse the causes of death for two misused ccTLDs, .tk and .cc. In both cases, we see the leading role of blacklists in preventing domain abuse, with some action of the registrar. For .tk, we see a difference in the death rates before and after the first day.
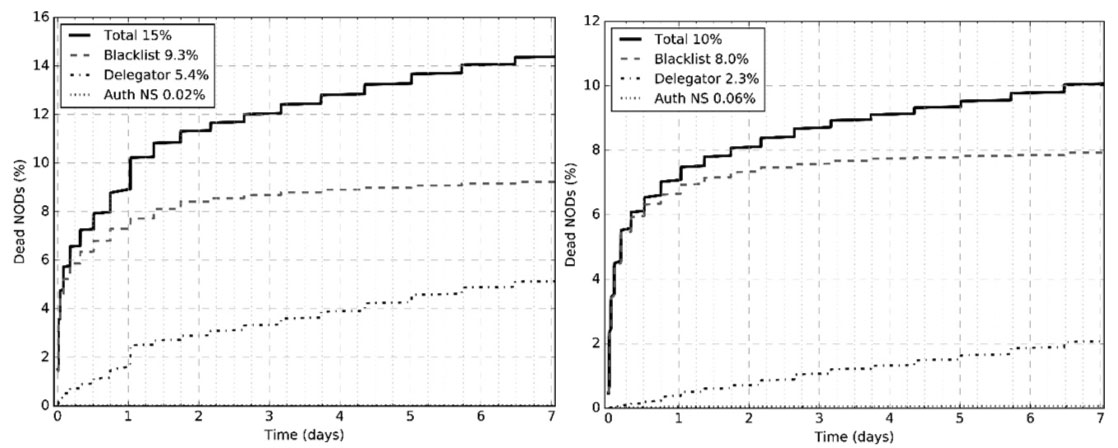 Figure 12: Causes of death for two ccTLDs: .tk (left) and .cc (right).
In summary, we think ccTLDs are in general well-protected from abuse, with a very important exception of some misused ccTLDs, which are no longer associated with a specific country.
Last, but not least, we analyse the legacy gTLDs. In Figure 13, we present the TLDs with more than 5K new domains. Note that .net is twice as likely to experience an early domain death as .org, which seems much better protected from abuse. The largest source of new domains on the Internet, the .com TLD, experienced just 5.8% of new domain deaths.
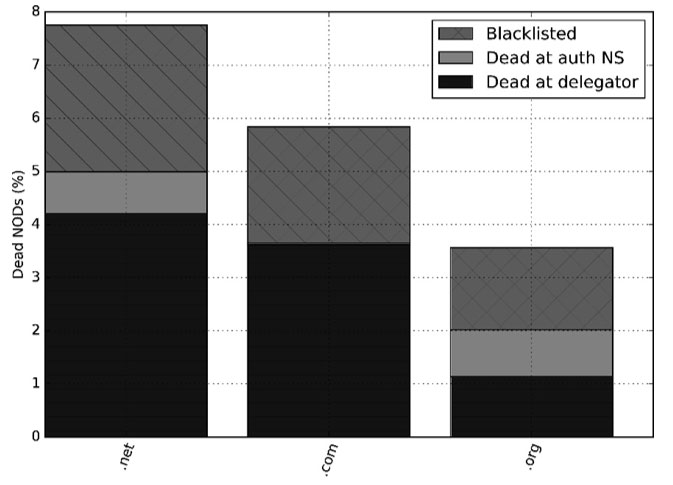 Figure 13: Legacy gTLDs and their death rates.
 Figure 14: Causes of death for two legacy TLDs: .com (left) and .net (right).
In Figure 14, we compare .com with .net. Surprisingly, only 2% of new domains under .com are blacklisted, and eventually the registrar plays a more important role, especially between the third and fifth day. For .net, we also see the leading role of the domain delegator. The vast majority of the 0.8% quick domain deaths detected at the authoritative DNS level were due to the Microsoft Azure cloud platform.
We presented a systematic study of the lifetime of newly observed domain names. We found that, on average, 9.3% of new domains effectively died in their first seven days, with a median time of just four hours and 16 minutes. This, however, differs considerably for various causes of deaths and TLDs. Blacklisting, which was responsible for 6.7% deaths, in the majority of cases blocked domains in under one hour, whereas DNS registrars and hosting providers needed more than three days. We also found great influence of the TLD. In general, the new gTLDs exhibited roughly three times as many quick deaths as the legacy gTLDs, with a dozen cases where more new domains died than survived their first week. Surprisingly, the largest TLD on the Internet, .com, exhibited only 2% of new domains being blacklisted, with 3.6% of new domains being deleted by the registrar.
We conclude that TLDs can be roughly divided into two classes: those that experience a high percentage of quick deaths among new domains (i.e. well above the average 9.3%), and those that do not. In the former case, it is usually associated with: a) registration under a new gTLD or under a misused ccTLD, b) cheap price, and c) few domain deletions at the TLD level.
Our research highlights the need for a secure DNS policy in a computer network. On the one hand, presumably the vast majority of 9.3% new domains will be used for cybercrime. On another hand, even blacklists need time to stop a potential incident, and they did not contain 26% of new domains that experienced a quick deletion at the TLD level (see Figure 4). Thus, a sensible DNS policy should block access to new domains for a few hours after detection, a few days, or even a week for maximum protection.
[1] Vixie, P. Taking Back the DNS. http://www.circleid.com/posts/20100728_taking_back_the_dns/.
[2] The Spamhaus Project. The World’s Most Abused TLDs. https://www.spamhaus.org/statistics/tlds/.
[3] Hao, S.; Feamster, N.; Pandrangi, R. Monitoring the Initial DNS Behavior of Malicious Domains. ACM Internet Measurement Conference IMC’11. 2011.
[4] Hao, S.; Thomas, M.; Paxson, V.; Feamster, N.; Kreibich, C.; Grier, C.; Hollenbeck, S. Understanding the Domain Registration Behavior of Spammers. ACM Internet Measurement Conference IMC’13. 2013.
[5] Weimer, F. Passive DNS replication. FIRST conference on computer security incident. 2005.
[6] Edmonds, R. ISC passive DNS architecture. Internet Systems Consortium, 2012.
[7] Mozilla Foundation. Public Suffix List. https://publicsuffix.org/learn/.
[8] The Spamhaus Project. The Domain Block List. https://www.spamhaus.org/dbl/.
[9] SURBL. Combined SURBL list. http://www.surbl.org/lists#multi.
[10] SWINOG. DNSBL at uribl.swinog.ch.
[11] NLnet Labs. Unbound. https://www.unbound.net/.
[12] Edmonds, R.; Vixie, P. dnstap. http://dnstap.info/.
[13] SQLite. https://www.sqlite.org/.
[14] TLD List. https://tld-list.com/.
[15] M3AAWG. Recommendations for Preserving Investments in New Generic Top-Level Domains (gTLDs). http://www.m3aawg.org/gTLDInvestments.
![]()