Splunk Inc., USA
Copyright © 2017 Virus Bulletin
Currently, many security operations teams struggle with obtaining useful passive DNS data post security breach. Security breaches are often detected quite some time after the attack. Due to the ephemeral and targeted nature of many malicious domains, existing well-known external passive DNS collections lack complete visibility to aid analysts in conducting incident response and malware forensics. We will present a new tool to collect local passive DNS data, which will enable security operations teams to conduct a more effective response against attacks involving malicious domains. Our presentation will consist of a demo of the PassiveDNS Splunk app, which will be released for public use. We will also outline how we architected this app, and describe each of its functions in detail.
The Domain Name Service (DNS) is vital to the Internet, translating user-friendly domain names into IP addresses. Due to the ubiquitous nature of DNS, threat actors leverage the service in order to blend their attacks into the noise of expected traffic. One way to achieve this is to automate the registration of many seemingly benign-looking domains, which can then be provisioned for callback actions from compromised hosts. These registered domains are highly ephemeral, in order to evade takedown attempts from the security community. Therefore, when a breach is eventually detected, it is very difficult, if not impossible, to gain visibility of the full scope of the attack without historical DNS resolutions.
In order to help mitigate this arms race, the research community has set up external DNS sensors to collect aggregate malicious DNS resolutions from various segments of the Internet. However, when an attacker crafts targeted attacks leveraging ephemeral, malicious DNS domains, there is a low probability that external DNS sensors will observe these malicious DNS resolutions from the victim's network. In these cases, the DNS sensor needs to be placed as close to the victim's network as possible, in order to observe the malicious traffic in time to aid in incident response operations.
There are additional third-party tools, such as PassiveTotal [1] and Farsight [2], that provide malicious DNS information for their customers. As convenient as these paid subscription services are, they will not provide all of the information that would be relevant to or required by an incident response team, due to the placement of their sensors. This results in limited, or incomplete visibility.
Figure 1 is an illustration of an endpoint host that is utilized by a user to browse a website that serves advertisements (e.g. cnn.com). When the user browses cnn.com, online ads are served. The first ad in this scenario is not malicious. The second ad rendered is malvertising, and finds a vulnerability in the endpoint host's web browser. At that point, the endpoint host is exploited, and malicious payloads are accessed and installed on the host.
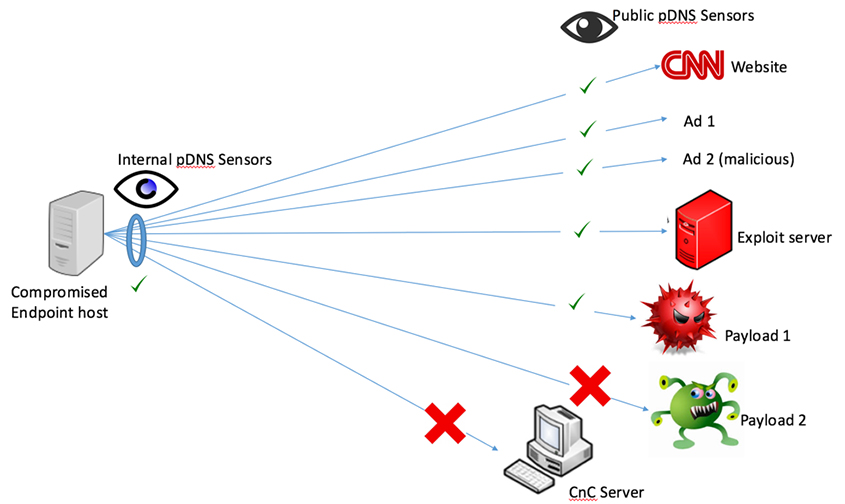 Figure 1: A drive-by download attack, showing visibility of public passive DNS sensors vs. a local passive DNS sensor.
After the initial infection and persistence of the malware, the callback phase begins. At this point, the C&C server issues commands to the compromised endpoint host. Often, the compromise of the endpoint host is targeted, especially in the last stages of the compromise. Although public passive DNS sensors are placed in networks that provide great visibility in most of the DNS traffic (e.g. ISP networks, etc.), these passive DNS sensors are not local to the targeted compromised endpoint host.
We have architected and built an application, PassiveDNS [3], to address the problem of limited visibility of malicious DNS domains. PassiveDNS utilizes another application, called Splunk App for Stream [4], that captures wire data for analytics and allows real-time network visibility. Both PassiveDNS and Splunk App for Stream applications install on the Splunk Enterprise platform [5].
Using this approach, we are successfully able to capture and store local DNS traffic, and allow post breach security incident responders to access artifacts related to malicious DNS domains queried by internal hosts.
In Sections 2, 3, and 4 of this paper, we will discuss the background and details of this project. We will cover the architecture of the PassiveDNS application, and outline the dependent underlying Splunk Enterprise platform and Splunk App for Stream application. In Section 5, we will discuss the process of building PassiveDNS, including design considerations. In Section 6, we will discuss our datasets, and how we tested and evaluated the efficacy of PassiveDNS. Finally, in Section 7, we will outline future considerations for the expansion of functionality in PassiveDNS to make it even more effective as a security operations tool.
PassiveDNS is a user interface (UI) built to work with DNS data, stored in Splunk Enterprise. In our implementation, we're utilizing Splunk App for Stream, which is an application that processes network traffic. Splunk App for Stream works in conjunction with the Splunk Enterprise platform, which collects and indexes log and machine data from any data source. Figure 2 shows a notional architectural diagram of PassiveDNS and its underlying dependencies.
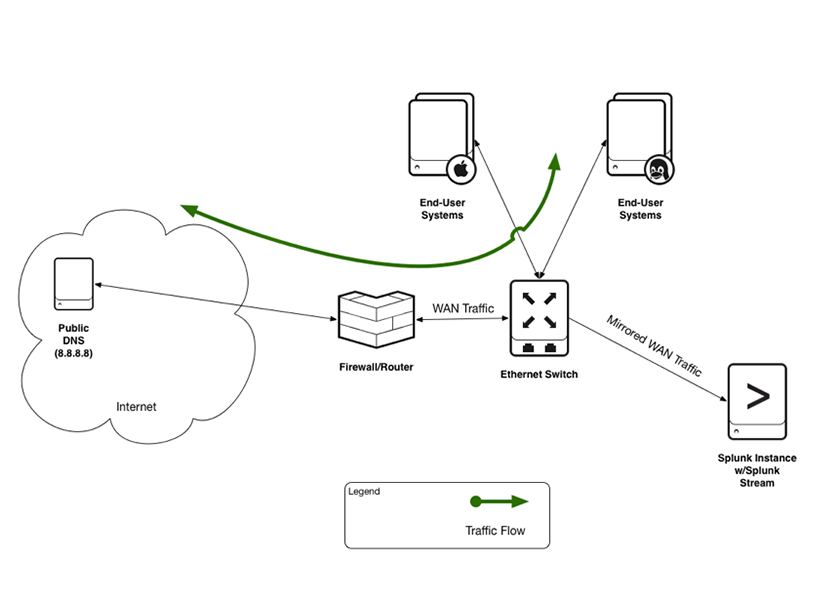 Figure 2: Notional architecture of PassiveDNS, as installed.
In building the architecture for PassiveDNS deployment, we utilized the Amazon Web Services (AWS) infrastructure to set up and install Splunk Enterprise, along with Splunk App for Stream. The existing volume of network traffic in the AWS infrastructure was too low for what we needed, so we utilized Splunk HTTP Event Collector [6] to introduce sufficient network traffic for analysis purposes. (In Section 6, we will provide more details about Splunk HTTP Event Collector and how we used it for this project.)
The core analytics engine for PassiveDNS is the Splunk Enterprise platform. The Splunk Enterprise platform is a software-based data indexer that can analyse all machine data. For example, network traffic, such as DNS data, can be ingested into the Splunk Enterprise platform through its schema-on-the-fly processing engine. Figure 3 shows the underlying Splunk Enterprise platform.
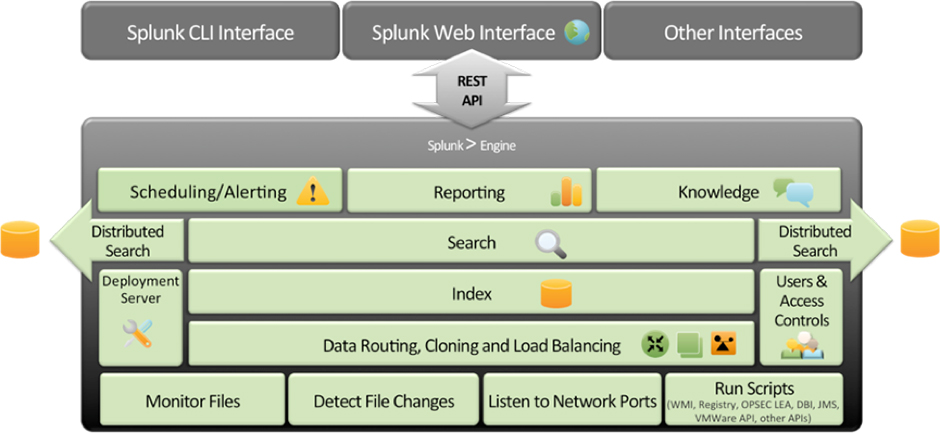 Figure 3: Splunk Enterprise platform.
Splunk Enterprise has significant capabilities, such as the ability to create lookup files and ingest those files into Splunk. The lookup capability allowed us to reference fields in an external CSV file that match fields in event data. Using this match, we enriched event data by adding more searchable fields to them. Lookup tables were created for blacklisted domains we obtained from the Malware Domains website [7].
We also made use of the Common Information Model (CIM) [8], which is collection of pre-configured data models that can be applied to data at search time. Each data model in the CIM consists of a set of field names and tags that define the least common denominator of a domain of interest. The CIM helps to normalize data to match a common standard, using the same field names and event tags for equivalent events from different sources or vendors. The CIM acts as a search-time schema ('schema-on-the-fly') to allow you to define relationships in the event data while leaving the raw machine data intact.
PassiveDNS provides a drilldown view of DNS data, collected by the Splunk App for Stream, which is the main processing engine that captures the DNS data in our scenario. Figure 4 shows a notional architecture diagram of Splunk App for Stream.
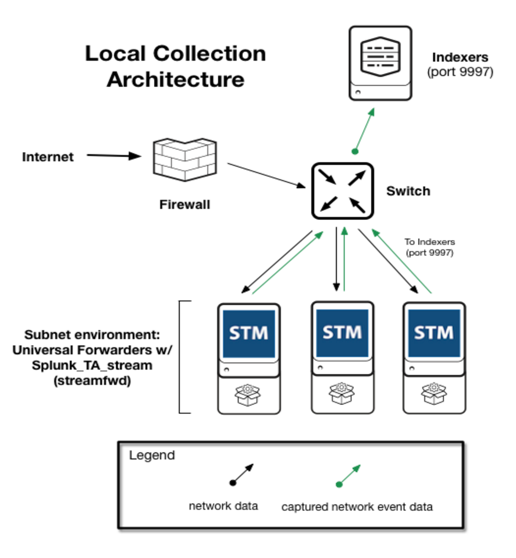 Figure 4: Notional architecture for Splunk App for Stream.
Splunk App for Stream allowed us to capture, filter, index and analyse streams of network event data. A 'stream' is a grouping of network event data that has a specific network data protocol. When combined with logs, metrics, and other information, the streams that are captured with Splunk App for Stream provide visibility into activities and behaviours occurring across the network infrastructure.
We utilize Splunk App for Stream to achieve the following:
Our main goal was to build an application that could facilitate local collection of passive DNS data. This data should be easy to utilize by threat intelligence analysts conducting research on and investigations of malicious domains. The data output should be presented in simple formats for sharing purposes. The application should be free of charge, thus enabling researchers to use the tool. We also outlined earlier that current solutions such as Farsight DNSDB and PassiveTotal, while helpful, have limited visibility, because they do not have sensors deployed on every network.
Our input data source is DNS-specific packet captures from the Splunk App for Stream application. The output of the PassiveDNS application is a series of analyst UIs that allow queries of IP addresses or domain names to find relevant DNS traffic that matches the queries.
For many network intrusions, attackers leverage ephemeral domains as command-and-control (C&C) nodes for their malware. When intelligence analysts conduct incident response even from events that are one week old, or days old, there are no results from their subsequent active domain name queries. For intelligence analysts, having access to a local passive DNS repository provides that historical data for intrusion analysis.
Our starting point for PassiveDNS assumes that we have relevant DNS data such as timestamps from when the DNS query was made, internal (or source) IP addresses, external (or destination) IP addresses, and external DNS domain names. These DNS domain names should include blacklisted domains that the analyst will investigate. Figure 5 shows a sample table of starting point entries.
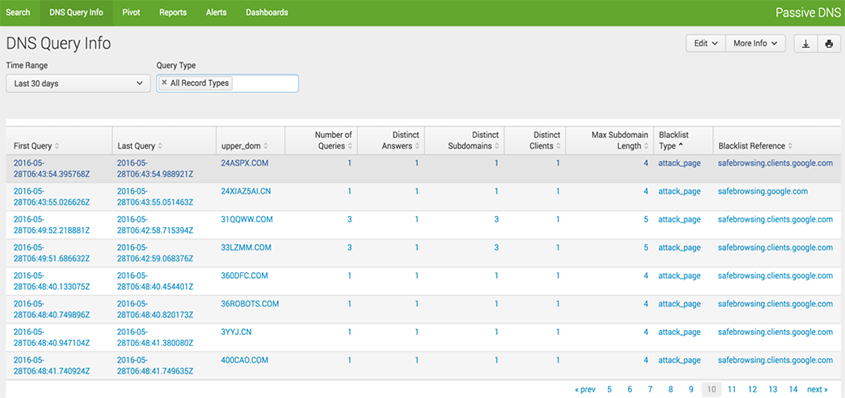 Figure 5: Starting point of relevant PassiveDNS data.
Note that an internal IP address makes three DNS requests to '31qqww.com' (which is blacklisted) during a short timeframe. We collapse the entries in order to allow the analyst to drill down to the next level of information. Figure 6 show the next step when the analyst drills down on the number of DNS queries made to '31qqww.com'.
Figure 6: Drilldown of count of DNS queries to '31qqww.com'.
When the analyst clicks on the number indicating the total number of times an endpoint host made a DNS request to a particular domain, the table in Figure 6 is the result. (In this example, the analyst clicked on the '3' in the 'Number of Queries' column, leading to the information shown in Figure 6.) The table in Figure 6 would be the true starting point of investigation for an analyst, since the table in Figure 5 might be too information dense for the analyst to process easily.
With the table shown in Figure 7, the analyst will have arrived at the final drilldown to see which internal hosts reached out to which specific external hosts (both IP addresses and external DNS names are shown here). There will be an exact timestamp range. Using this information, the analyst will be able to continue the investigation by visualizing and correlating this data, and pivoting as needed to create a diagram of potentially infected hosts.

Figure 7: Next drilldown table showing DNS request counts and external IP addresses of blacklisted domain.
To be clear, PassiveDNS does not capture full raw network packets, nor does Splunk App for Stream. Therefore, in order to further the investigation, the analyst would need to access other deployed technologies in the network, such as a full packet capture capability, and search for network packets that could be reconstructed to further investigate the malicious actions taken around the time of the breach.
In the PassiveDNS application, we built search queries to search through the indexed DNS data and manipulate that data into table formats. For example, we needed to write the following query, using Splunk Search Processing Language (SPL) to pull information about the DNS queries:
| datamodel Network_Resolution DNS search | stats last(timestamp) first(endtime) count(DNS.query) AS "Number of Queries" dc(DNS.ut_subdomain) AS "Distinct Subdomains" dc(DNS.src) AS "Distinct Clients" by DNS.ut_domain | lookup mw_domain_lookup domain AS DNS.ut_domain OUTPUT type AS "Blacklist Type" original_reference AS "Blacklist Reference"
While working on this project, we needed to obtain sufficient and meaningful data to test our SPL results. This proved to be non-trivial. We worked with open-sourced blacklists from malwaredomains.com. PassiveDNS was deployed and tested in the AWS infrastructure. The initial network traffic volume was very low, and we needed to increase it for validation purposes. To that end, we were able to utilize Splunk HTTP Event Collector (EC), which enabled us to send data over HTTP (or HTTPS) directly to Splunk Enterprise from the application.
The basics of Splunk HTTP Event Collector are relatively simple:
While you can send any kind of data to Splunk Enterprise through HTTP Event Collector, it must be contained within a JSON payload envelope. You can simplify the process by using a logging library, such as Splunk Logging for Java or Splunk Logging for .NET, which will automatically package and send data to HTTP Event Collector in the correct format. HTTP Event Collector also supports the assigning of different source types, indexes, and groups of indexers ('output groups'), so you can fine-tune where and how your data is consumed by Splunk Enterprise. You can use a Deployment Server to deploy HTTP Event Collector configuration files.
We have developed a software-based application, PassiveDNS, that installs as an overlay on Splunk App for Stream and Splunk Enterprise. PassiveDNS allows intelligence analysts to effectively triage and drilldown on DNS queries made from internal hosts to external blacklisted domains, using the local repository of DNS traffic. Therefore, even if an attack or breach is discovered some time after it initially occurred, there is no concern as to whether the domain is still available, as this data is gleaned from local sources.
For future versions of PassiveDNS, we are hoping to integrate the tool with other passive DNS tools developed for Splunk Enterprise. Two examples of such tools are PassiveTotal for Splunk, and Farsight for Splunk. Some of the users of PassiveDNS tool will probably have paid subscriptions to PassiveTotal and/or Farsight DNSDB. These users could get access to their feeds from PassiveTotal or Farsight, even while using the PassiveDNS tool. This will reduce the amount of time analysts need to pivot between applications, and create a more efficient visualization of aggregate data on their UI dashboards.
[1] PassiveTotal. https://www.passivetotal.org/.
[2] Farsight DNSDB. https://www.farsightsecurity.com/DNSDB/.
[3] PassiveDNS Project. https://github.com/sbrant/pdns.
[4] Splunk App for Stream. http://www.splunk.com/en_us/products/splunk-app-for-stream.html.
[5] Splunk Enterprise platform. http://www.splunk.com/en_us/products/splunk-enterprise.html.
[6] Splunk HTTP Event Collector. http://dev.splunk.com/view/event-collector/SP-CAAAE6M.
[7] Malware Domains. http://www.malwaredomains.com/.
[8] Common Information Model. http://docs.splunk.com/Documentation/CIM/latest/User/Overview.
[9] FireEye, Inc. M-Trends Report 2015. https://www2.fireeye.com/rs/fireye/images/rpt-m-trends-2015.pdf.
[10] Birge, L.; Kirda, E.; Kruegel, C.; Balduzzi, M. EXPOSURE: Finding Malicious Domains Using Passive DNS Analysis. http://www.internetsociety.org/sites/default/files/bilg.pdf.
[11] Weimer, F. Passive DNS Replication. http://www.enyo.de/fw/software/dnslogger/first2005-paper.pdf.
[12] Edmonds, R. ISC Passive DNS Architecture. https://www.farsightsecurity.com/Technical/Passive_DNS/passive-dns-architecture.pdf.
[13] Dixon, B.; Ginty, S. Rethinking Passive DNS. https://www.issummit.org/2015/pdf/Day2-Track2.5.pdf.