2015-01-26
Abstract
Thibault Reuille, Dhia Mahjoub and Ping Yan use particle physics to shows clusters of malicious domains.
Copyright © 2015 Virus Bulletin
When predicting and containing malware or botnet infections, we can use some ideas from studies of disease epidemics.
The malware research community has long dedicated its expertise to dissecting malware binaries and examining footprints on victim systems – studying the disease and the patient in an isolated environment, if using the disease study as an analogy.
Using the same analogy, our approach is different. Instead of studying the bad actors (diseases) themselves, we study a collective pool of victims (patients) and the behaviour of bad actors (diseases). We have built mathematical and statistical models for identifying the correlations of symptoms/IOCs (indicators of compromise), which help to further pinpoint unknown bad actors. Our data-driven analytical models help us effectively extend intelligence from an initial event onwards incrementally.
At the same time, intelligence exploration can greatly be assisted by the use of a sophisticated visualization engine, as the simple truth is that a picture is worth a thousand words. We will introduce our in-house-developed OpenGL visualization engine that supports large-scale data 3D graphing and interactive intelligence searching. In our presentation, we will have a number of 3D demos to accompany our use cases and some very interesting ways of looking at data and intelligence. The design of the system facilitates an improved user experience for our day-to-day intelligence researchers.
Over the past few decades, the tech world has been investing quite a bit of time and effort into the creation of robust distributed cloud systems, and the increasing need for resources and performance leads us to a decentralized agglomeration of data acting transparently as a whole. This new face of the Internet as we know it involves many actors: some focus on storage, some may focus on routing, some are in charge of keeping the information up to date, and finally, the users of such a system are the key agents that constantly create fresh content. We are building organized structures that are beginning to function more and more like primitive digital brains designed to perform specific tasks.
These shared knowledge databases have brought about a new challenge: how do we keep track of the current state of such a dynamic system?
Indeed, it is not an easy task. Modern systems include billions of elements, and in most cases users can add, delete and modify items at any time. And because the data is decentralized, it can be pretty tricky to be sure that we’re looking at an up-to-date version of the system. Last but not least, in many situations, we are interested not only in visualizing the current system, but also the evolution of that system over time. Depending on how the databases are built and how the various modifications are stored, this task can become extremely complex in terms of memory usage, processing time and data consistency.
Furthermore, what about the visualization perspective? How do we choose a layout that works for our needs? That is, how do we design a visualization technique that will be able to represent a structure that evolves constantly over time?
Of course, we can’t answer those questions all at once; in this paper, we first propose a generic framework for intelligent algorithmic design, which is essential for intelligence drilling in the big data era. We will discuss a few models that we built based on the transactional behaviour of DNS traffic to effectively keep track of one of the most notorious ransomware infections – Cryptolocker. We will then discuss at length how to design and develop a visual representation of the enormous amount of data with intelligent exploration processes embedded and enabled in an interactive form.
The result is an interactive visualization platform graphing the network activities of the global data flow for interactive intelligence exploration and anomaly detection.
When predicting and containing malware or botnet infections we can make use of some ideas from disease epidemic studies.
The malware research community has long engaged its expertise in dissecting malware binaries and examining footprints on victims’ systems – studying the diseases or the patients in an isolated environment, if using epidemiology as an analogy. The problems are obvious:
Chasing badware can never keep up with the speed of its appearance [1].
Detection happens after a system is infected (if an effective detection ever takes place).
While sticking with the same analogy, how about taking a different approach? Instead of studying the bad actors (diseases) themselves, how about studying the behaviour of the bad actors (diseases) or the collective behaviour of victims (patients)? Is it possible to build mathematical and statistical models that reveal and locate the anomalies by observing the global data flow? Are we able to identify the correlations between indicators of compromise (IOCs) (or symptoms, if using the disease analogy) to help us further pinpoint unknown bad actors? Furthermore, can these models be predictive of attacks or threats, i.e. even before the threats or attacks materialize, can these models catch the indicators or perimeters of attack infrastructures? In a more relaxed form, can we predict patient Z if we can successfully track down patient X or patient Y and stop the infection chain as soon as the data reveals it? The faster we track down the chain, the more effectively we will identify and contain a threat.
There is a vast amount of literature available on data analytics and machine learning across various domains. The best-known success cases with a data-driven approach include Netflix and Amazon’s recommendation systems that build on the customer viewing or rating datasets [2]. Data-driven analytics have been heavily drawn upon for uses in the health care industry [3] and may even have a potential use in solving the world hunger problem [4]. The more recent development of data-centric methodologies has extended to the social network space, where each individual’s activity across years or decades is stored and analysed across almost the entire population. However, the security industry has lagged behind in adopting the most sophisticated data-driven techniques, both due to the lack of clean-cut quality of data and the data science mentalities.
In this article, we will not go into a full-length discussion of data management and data modelling, instead we will present our best practice of applying the technology stack of data exploration and discovery algorithms development to Internet threat detection. We will introduce a four-dimensional view for data modelling and exploration, and then demonstrate the modelling exploration process with a real-world case study. We developed an intelligent recursive process – the ripple effect –for Cryptolocker C&C (command and control) detection.
In the domain space of information security, the most challenging part is to pick out small unusual events from an enormous amount of data and intelligence. It is analogous to finding a needle in a haystack. Statistics and computational machine learning are great solutions for analysing things that are extremely common, but often fall short in identifying low-frequency events that are, in fact the security incidences of interest.
At the same time, the big data phenomenon has started to impact the information security domain. Increasingly rapidly and more cost-effectively, firms are stocking up a large variety of machine data within or outside of their networks. For one reason, applications and data are increasingly accessed via cloud services and mobile devices, which poses new risks and produces more scattered traces. For another, attackers are becoming more sophisticated and more adept at orchestrating complex attacks that evade traditional static detection measures. Organizations need to evaluate and capture all possible security related information available to them, both on their premises and on peripherals, both internally and externally, to maintain control and visibility.
Now the question becomes whether and how the big data and its promised analytical capabilities may advance security detection and prevention for enterprises.
‘Big data analytics’ is rather an abstract term to most. In this paper, we describe applying big data analytics at OpenDNS to provides a structured and concrete use case that may assist people with transitioning into a data-driven security threat management age.
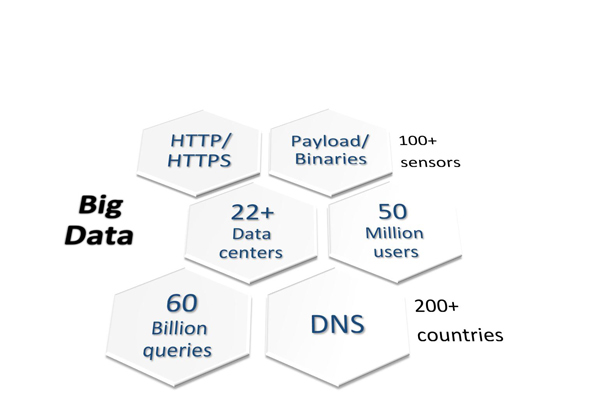
At OpenDNS, there are two dozen data centres around the globe. There are more than 100 DNS resolvers serving up to 50 million users that generate about 60 billion queries a day (Figure 1).
Running any analytics on this scale is already a challenge itself, so how does one develop meaningful models for effective detection of security threats? The first step we took was to simplify it.
Cryptolocker is one of the most notorious pieces of ransomware. First found in September 2013, Cryptolocker uses highly sophisticated cryptographic key pairs to encrypt the computer files of its victims. Hundreds of dollars are extorted from victims in order for them to receive the key necessary to unlock their files. It has been estimated that, as of April 2014, Cryptolocker had infected more than 234,000 computers. One estimate indicates that ransom payments amounting to more than $27 million in were made in just the first two months since Cryptolocker emerged [5].
In the process of infecting and locking up a victim, the ransomware first needs to establish connections with its command and control (C&C) servers to retrieve an encryption key. Keeping the encryption keys on remote servers prevents the victim from recovering the key pairs. As intuitive as it seems, if one can quickly determine what these C&C domains are, and prevent the malware from phoning home, the victim’s data files would most likely be left intact.
The C&C servers it looks up are generated dynamically by the malware. The embedded algorithm is called a DGA (Domain Generation Algorithm). DGAs enable malware to evade static blacklists or reputation systems, and avoid reactive countermeasures.
Many existing approaches must collect and then analyse the binary code of every Cryptolocker variant. For them to detect the C&C domains, the only solution is to reverse the DGA. However, this technique is time-intensive and leaves the victim vulnerable as the polymorphic malware evades signature-based detection.
With a data-driven algorithmic detection technique, we forego the arduous task of uncovering the DGA algorithm. This technique relies on the global DNS clients’ behavioural patterns, observing that Cryptolocker victims are all sending a big round of DNS lookups to a fixed set of domains. We think it’s a pretty neat process, so we’ve given it a name: the ripple effect.
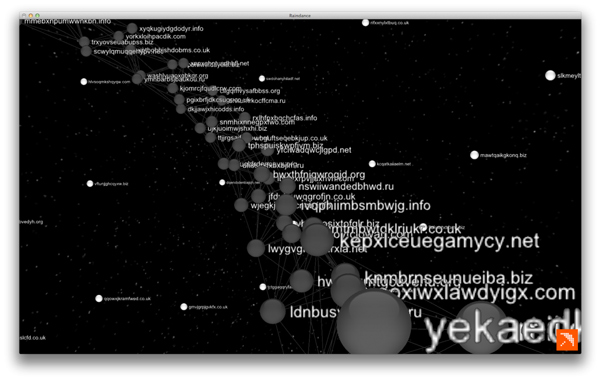
The discovery process starts with a set of known Cryptolocker C&Cs. Given this seed set of known domains, we start searching the unknown ones by expanding the co-occurring domains with the known ones. For two domains to co-occur means that a statistically significant number of clients have requested both domains consecutively in a small time frame. The co-occurring behaviour is due to the fact that Cryptolocker phones home at 1,000 domains each day, of which only a few are registered and serve as C&Cs. The 1,000 domains were requested in a small time frame, and this behaviour spreads across all victimized OpenDNS users. We thus derive the co occurring index between known Cryptolocker C&Cs and unknown ones by looking at a weighted ratio of the frequency with which these domains were requested by the same set of client IPs versus the frequency with which the domains appear with the rest of all domains. The co-occurring behaviour resembles a shopping basket analysis [6].
The recursive process is demonstrated in the following pseudo-algorithm:
K = set(known domains) # seed domains
S = K
N = K # the first ripple
WHILE N is not empty:
  for n in N:
    Sn = set(domains co-occurred with n)
    S = S.union(Sn)
  N = S.difference(K)
  K = S
Figure 3 shows the ripple effect expanding the co-occurrence domains from the set of seed domains that we started with. The recursive technique ended up detecting all Cryptolocker domains for each day without knowing the DGA.
The Security Graph (recently rebranded ‘Investigate’) is a wonderful tool to provide insights and detailed analysis of Internet traffic based on the traffic of OpenDNS’s clients. It exposes a handful of accurate pieces of information and indicators based on real-time data. Such indicators can effectively be used in modern machine-learning algorithms or various classifiers; researchers are constantly refining their threat detection methods to help build a safer Internet.
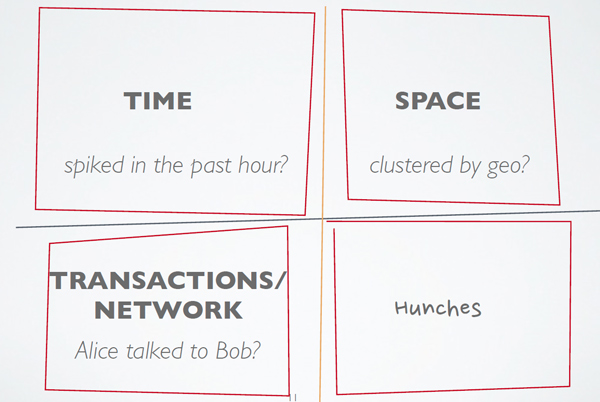
But how can we take those methods to the next level when we are easily overwhelmed by the amount of data? How do we decide what indicator to choose? How do we filter out the irrelevant part of the data that we don’t need in order to solve a precise problem? How do we approach a problem when there are so many ways to dig inside our large-scale data clusters? How do we build assumptions, hypotheses and proof-of-concepts for a specific problem? There is obviously no generic answer, but one thing is for sure: we need an accurate overall view of the data we are dealing with before we can jump to any conclusion. This is exactly where data visualization comes into play as a new way to dig inside the data and communicate our discoveries efficiently.
The Security Graph (Investigate), for example, is full of DNS metrics, but if we step back and try to look at the bigger picture, it is in reality very simple: the Security Graph is a knowledgebase of Internet entities and various connections between them. On a theoretical level, it is a set of nodes and a set of edges which can both have a lot of different attributes.
For us, it is now pretty clear that designing a powerful visualization engine capable of monitoring graphs and especially large graphs is the key to take threat detection, or more generally, pattern detection to the next level. In our presentation, we will guide the audience through our research and innovative approach to building such an engine and demonstrate how we can use it in real-world cases.
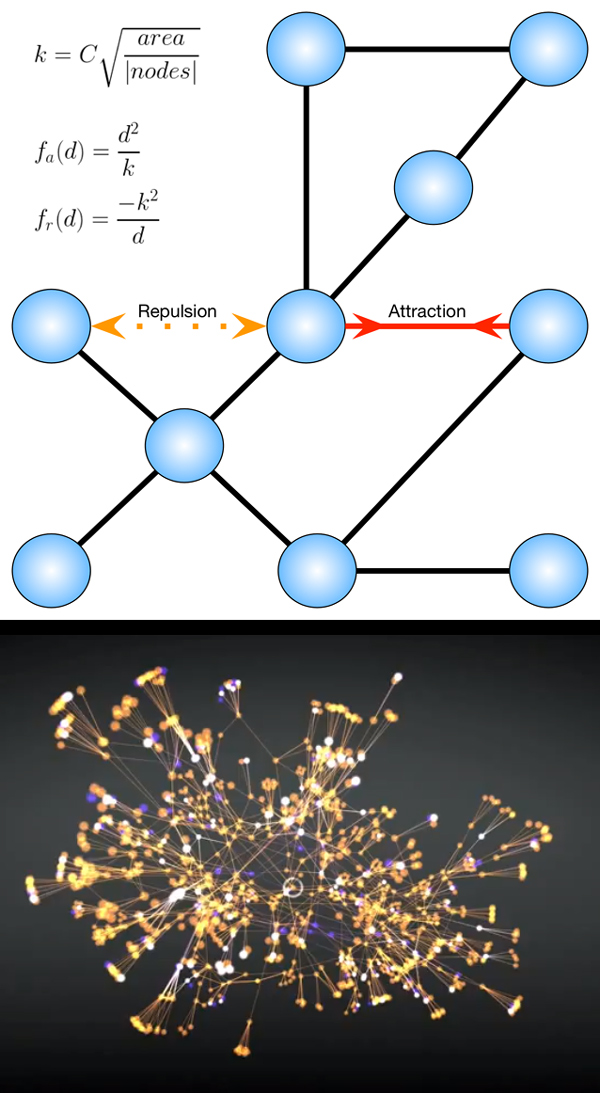
When it comes to graph visualization, there are many approaches to the problem. But if we want to focus on the study of the structure of the graph, the state of the art generally revolves around force-directed layouts [7], [8]. Since the main purpose of the engine is to analyse the topology of our knowledgebase, we need to choose a visualization technique that will let the data drive its own layout. The general concept is fairly simple: every node is treated as a particle and every edge as a force on the particles. By implementing an engine capable of running a particle physics model we can transform relational data into a 2D or 3D structure that is completely defined by the shape of the relational structure, therefore highlighting hidden clusters or topological patterns that may have gone completely unnoticed beforehand.
A diagram describing a simple force-directed model is shown in Figure 5. Without entering into too many technical details about the maths supporting the model, the principle is elementary: connected nodes attract each other and non-connected nodes repulse each other. The result is a molecule-shaped layout where relational clusters will aggregate in the same areas. This makes perfect sense, since that specific physics model is inspired by the electrical forces between electrons at the atomic level.
However there is more. Visualizing a graph with a bunch of nodes and edges is absolutely not enough for modern-day requirements. Force-directed layout algorithms increase in complexity as the size of the graph grows. So how do we apply it to large-scale datasets? The answer is parallelization. With recent graphic cards we can take advantage of efficient GPUs and distribute the calculation on their ever-increasing number of cores and threads. GPUs are becoming insanely good at working with geometrical data such as vectors, colours, matrices, textures or any kind of computation involving a combination of these. Using technologies such as OpenGL rendering, GLSL shaders and OpenCL physics seems like the obvious choice to leverage the power of GPUs. We will also present some implementations and technical details of our data visualization engine.
Combining intelligent data-mining techniques with smart data visualization is the key to gaining a better understanding of the problems we are trying to solve. In order to take a significant step forward in monitoring and managing a large-scale state machine in constant evolution, passive introspection is not enough. We need to build an interface that is capable of taking some action over the system either by visually and manually modifying it or by automatically applying some modification procedures based on an algorithmic decision.
Every day, data scientists have to deal with real-world data. This data can be described by trying to understand its implicit nature. We discover rules, biases, directions, exceptions, tendencies, anomalies or any kind of noticeable feature that can be used to empirically understand the behaviour of the beast we are trying to tame. By using topological data analysis, we find that real-world models often follow a shape. In practice, we are trying to discover the model of the model, in other words, the ontology. If such a model can be found then we can write programs to detect patterns following the same ontology. And finally, if the detection occurrences also follow a given pattern that we are able to identify, then structural events can be predicted, therefore anticipated.
By presenting our data visualization tool, we are putting in place the first blocks of a next-generation program intelligence. The goal is to expose techniques to build a large-scale, distributed and graph-based data-monitoring system.
Every day, servers exchange enormous amounts of data. Usually, this data is kept and archived for a defined period of time. As we store more and more information, our desire to understand its behaviour grows. The reason is simple: knowledge is powerful. If we identify a pattern in our past, we can master the present – and then we can predict the future.
Today’s data scientists are the modern oracles, always trying to discover ingenious ways to analyse information in order to identify new patterns and anomalies. Just as the first astronomers raised their eyes to the sky and clouds to predict the seasons, we are constantly analysing a deluge of digital messages to monitor the general state of the system. It is crucial to step back and take a look at the big picture and understand that abstraction is the key to mastering the present.
[2] Linden, G.; Smith, B.; York, J. Amazon. com recommendations: Item-to-item collaborative filtering. Internet Computing, IEEE 7.1 (2003): 76–80.
[3] Yan, P.; Zeng, D.; Chen, H. A review of public health syndromic surveillance systems. Intelligence and Security Informatics. Springer Berlin Heidelberg, 2006. 249–260.
![]()