2014-08-07
Abstract
This month each of the 15 participating full solutions achieved a VBSpam award – making it the second ‘full house’ in a row. What’s more, there were eight solutions that achieved a VBSpam+ award for blocking more than 99.5% of spam, while generating no false positives at all in the ham corpus, and very few in the newsletter corpus. Martijn Grooten has the details.
Copyright © 2014 Virus Bulletin
Wearing my new hat as Editor of VB, I have already expressed my excitement about our decision to make all past and future VB content freely available to all [1]. On switching to the hat of the guy that runs the VBSpam tests (one that, as of recently, I have started sharing with others), I am, if anything, even more excited.
From speaking to VBSpam participants, I know how many of them value the results and feedback included as part of the test: this information helps them understand how well they perform compared to their competitors, and helps them to see in which areas their products can be improved. But the reports are valuable not just for product developers and those looking to purchase a new email security solution: they also provide a good overview of the current ‘state of spam’ – and thus are interesting for anyone concerned with email security.
To make the reports easier to digest for those who are particularly interested in the latter, this month we have split the report in two. The full report contains all of the technical details and provides information on all participating products, while this summary provides a digest of the results as well as some information on the state of spam.
The VBSpam tests started in May 2009 and have been running every two months since then. They use a number of live email streams (with spam feeds provided by Project Honey Pot and Abusix), which are sent to participating products in parallel to measure their ability both to block spam and to correctly identify various kinds of legitimate emails. Products that combine a high spam catch rate with a low false positive rate (the percentage of legitimate emails that are blocked) achieve a VBSpam award, while those that do this exceptionally well earn a VBSpam+ award.
This month’s test saw 15 full anti-spam solutions and two DNS blacklists on the test bench. Filtering more than 130,000 emails over a 17-day period, all 15 of the full solutions performed well enough to achieve a VBSpam award, and eight of them achieved a VBSpam+ award. (Given that DNS blacklists are supposed to be integrated into an anti-spam solution, rather than run on their own, it is not reasonable to expect them to meet our strict thresholds. Thus, while these solutions didn’t achieve a VBSpam award, they certainly didn’t ‘fail’ the test.) This excellent set of results – the second ‘full house’ in a row – demonstrates that, while spam remains a problem, there are many solutions available that do a very good job of mitigating it.
The next VBSpam test will run in August 2014, with the results scheduled for publication in September. Developers interested in submitting products should email [email protected].
The fact that each of the 15 participating full solutions achieved a VBSpam award should be the main message to take away from this test: the spam problem can easily be controlled as long as a good anti-spam solution is used, and there are many such solutions available.
Of course, the details do matter. The good news is that no fewer than eight products – Bitdefender, ESET, FortiMail, Kaspersky LMS, Libra Esva, Netmail Secure, OnlyMyEmail and ZEROSPAM – achieved a VBSpam+ award for blocking more than 99.5% of spam, while generating no false positives at all in the ham corpus, and very few false positives in the newsletter corpus.
The slightly less good news is the fact that the average spam email was harder to block during this test than it was during earlier ones: compared to the test run carried out in May, a spam email was one third more likely to be missed by a spam filter this time. In fact, the average false negative rate (the percentage of spam missed by a product) increased from 0.22% to 0.30%. These numbers are small, so there isn’t great cause for concern, and the change may simply be a consequence of the versatile spam landscape. Still, it is good to keep an eye on the figures.
Against this drop in spam catch rates stood a drop in false positive rates. Products had fewer problems making sure they avoid blocking legitimate emails than they did in May. Given that false positives are a hidden cost to the use of an email security solution (and, indeed, security products in general), this is certainly good news.
In June, Symantec reported [2] a sudden spike in ‘image spam’: spam with an image embedded in the email. The period in which the vendor reported seeing a lot of image spam coincided with the first three days of the test.
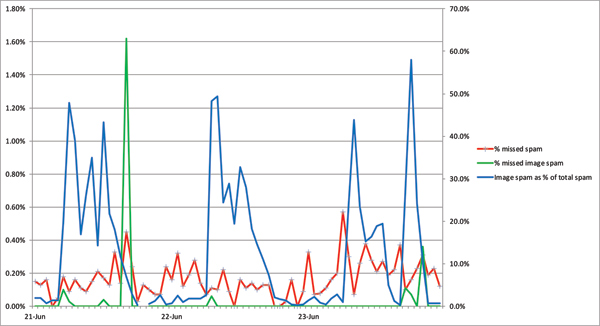
We also saw some spikes in image spam in our feeds: during short intervals, more than half of all spam emails contained an embedded image. While interesting, we found this didn’t cause a problem for the participating spam filters.
In the early days of spam, when most spam filters merely parsed the text content of an email, embedding the payload in an image was an effective method of bypassing filters. These days, filters are far more advanced: not only are many of them capable of reading text inside images, they also use ephemeral methods to block spam, even if no text content is included.
In Figure 1, one sees the percentage of image spam during the first few days of the test (the blue line, which corresponds to the right-hand y-axis) set against the block rate of image spam and all spam (the green and red lines, corresponding to the left-hand y-axis). One notices that in general, and especially during the spikes in image spam, this kind of spam was actually less likely to be missed.

Figure 1. Percentage of image spam during the first few days of the test, against the block rate of image spam and that of all spam.
(Click here to view a larger version of Figure 1.)
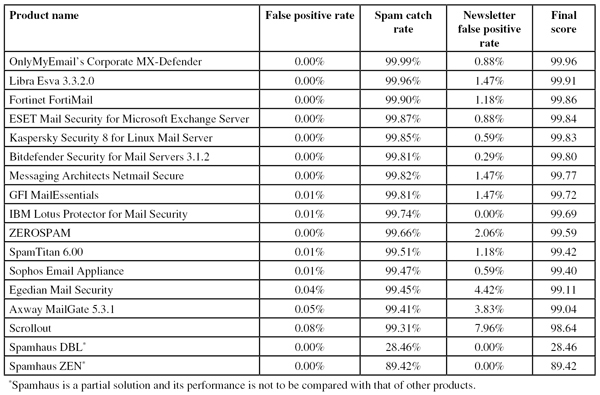
Note that in the table below, products are ranked by their ‘final score’. This score combines the three percentages (spam catch rate, false positive rate and newsletter false positive rate) in a single metric. However, readers are encouraged to consult the in-depth report for the full details and if deemed appropriate, use their own formulas to compare products.

(Click here to view a larger version of the table.)
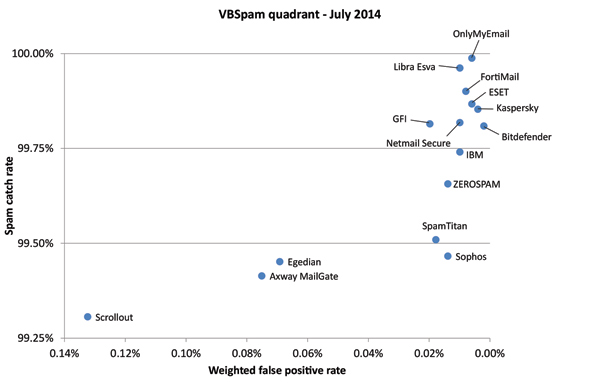
In the VBSpam quadrant, the products’ spam catch rates are set against their ‘weighted false positive rates’, the latter being a combination of the two false positive rates, with extra weight on the ham feed. An ideal product would be placed in the top right corner of the quadrant.

(Click here to view a larger version of the chart.)