2006-01-01
Abstract
Gabor Szappanos asks whether we have a realistic picture of what threats are bothering end users.
Copyright © 2006 Virus Bulletin
Do we know what is spreading out there? We, the anti-virus industry, at least pretend that we do. How about our users? From recent experience, it seems that neither we nor they have a truly accurate picture. First, consider the press. Their attention turns only to the latest and most destructive email virus as if it was the greatest threat of them all. Are they to blame? Not really. We are feeding them with data. So, let's turn our attention to ourselves.
The Virus Bulletin prevalence table for October 2005 reports the following:
| Win32/Mytob | 53.21% |
| Win32/Netsky | 36.16% |
| Win32/Mydoom | 5.06% |
| Win32/Bagle | 1.86% |
| Win32/Zafi | 0.74% |
| Win32/Sdbot | 0.69% |
| Win32/Funlove | 0.38% |
| Others | 1.9% |
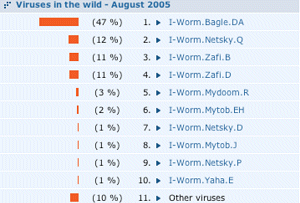
Politically, it might not be the wisest idea to point the finger of blame at Virus Bulletin in an article published here. So, are anti-virus vendors any better? One of VirusBuster's recent prevalence lists presented this top ten:

So, it seems that everyone agrees that email worms rule the known malware universe, with a few Trojan disturbances. In fact, nothing could be further from the truth. Support departments report that the majority of their support calls come from customers experiencing problems caused by Trojans, adware and spyware.
This should be reflected in the statistics, so why isn't it? The problem lies in the methodology we use to collect statistics. The easiest way to do it is to collect information from email gateway logs. But that information relates to captured infected emails. One infected PC may send out zillions of infected emails. While the total number of captures is related to the number of infected systems, it is not a one-to-one ratio.
We collect statistics from other sources, as well. This includes user reports and statistics gathered from other types of malware trap. How are these data merged? A user reporting a malware infection represents one infected computer. Meanwhile, 100 captures of Zafi.B may also represent a single infected PC. How do we compare apples with oranges?
Obviously, some form of normalization is needed. The only remaining detail is the question of the normalization factors. Fortunately, in certain cases we have been able to measure it. Apart from spreading in email Zafi.B also performs a DDoS attack on the VirusBuster web server (www.virusbuster.hu). This gave us the opportunity to estimate the number of computers infected with Zafi.B.
In a one-hour period on 14 June 2004 we experienced attacks from 105,926 different IP addresses. During the same period MessageLabs reported 169,211 infected messages (from 6,459 different hosts). This means that at their measurement point one infected host generated 26.19 messages per day, or 786 infected messages per month. The raw capture statistics of our email traps for September 2005 are as follows:
| I-Worm.Netsky.Q1 | 523,074 |
| I-Worm.Zafi.B | 501,265 |
| I-Worm.Zafi.D | 481,479 |
| I-Worm.Mydoom.R | 119,185 |
| Trojan.DL.Bagle.DA | 90,657 |
| I-Worm.MyTob.H | 68,801 |
| I-Worm.Netsky.D3 | 65,640 |
| I-Worm.Mytob.J | 63,074 |
| I-Worm.NetSky.Z | 53,729 |
| I-Worm.Yaha.E | 45,652 |
| I-Worm.Netsky.P | 27,017 |
| I-Worm.Mytob.FV | 23,476 |
| I-Worm.Mytob.DR | 19,673 |
| I-Worm.Netsky.R | 14,991 |
| I-Worm.Mytob.FA | 13,060 |
| I-Worm.Netsky.B | 12,325 |
| I-Worm.Mytob.FC | 11,312 |
| I-Worm.Mytob.DU | 10,647 |
| I-Worm.Mytob.IY | 10,001 |
| I-Worm.Klez.H | 9,773 |
At this time, our web server logs indicated that there were slightly more than 10,000 Zafi.B infected computers. This means that at this measurement point we have 50 messages per infected host per month. Unfortunately, the normalization factors differ not only with the particular virus variants, but they also vary between different measurement points. Rather hopeless indeed.
Regrettably, we do not have similar data for other email worms. So there is no general solution for obtaining the number of infected PCs from the number of infected messages captured. One could try to extract the original sender from the emails and count all the messages coming from the same PC as only one infection, but that information is not always available to those who gather the statistics.
Email is not the only media that is used for spreading viruses. Network worms spread via open (or weakly protected) network shares and/or using Windows vulnerabilities. These worms can be captured using SMB traps, or protocol (or rather vulnerability) emulator traps. Protocol emulator traps exist for Windows operating systems (WormRadar, iDefense Multipot, HBPot), as well as for x86 Linux operating systems (mwcollect, nepenthes). The success of these traps lies in the extent to which they support the shell codes used by different worms, therefore they require periodical updating.
Malware collected with mwcollect in July and August 2005 shows the following distribution:
| Worm.RBot.BTW | 8.33% |
| Worm.Rbot.BYE | 8.05% |
| Trojan.DR.Juntador.N | 7.26% |
| Worm.Codbot.Y | 5.72% |
| Worm.RBot.BWY | 4.84% |
| Worm.RBot.BZQ | 4.56% |
| Worm.RBot.BXS | 4.51% |
| Worm.RBot.BWL | 3.96% |
| Worm.RBot.BYD | 3.58% |
| Worm.RBot.BZV | 2.93% |
| Trojan.DR.Juntador.M | 2.79% |
| Worm.RBot.BXR | 2.70% |
| Worm.RBot.CCC | 2.23% |
| Worm.RBot.BZM | 2.23% |
| Trojan.DR.Juntador.D | 2.14% |
| Other | 34.16% |
It is important to note the appearance of the Juntador droppers, which are self-spreading packages with a custom dropper, usually consisting of an RBot variant (responsible for spreading to other hosts) and an adware installer. Clearly the intention is to use the botnets to install adware packages.
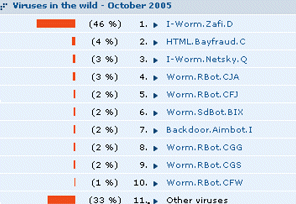
With reasonable normalization of data, and merging the statistics coming from our different traps and user reports, our latest monthly prevalence list looks like this:

Which is starting to look more realistic.
Is there any hope of getting some real-world data? Yes, we can collect statistics from infected user PCs. There are different approaches for this.
One is to use native worm traps. These are real computers with default OS installations without security patches, connected to the Internet. The great advantage of this approach is that we can collect the samples grabbed by the downloaders as well. The dropped files are also available on these traps. This means that all samples related to an incident are present. The statistics collected from these traps give the best estimate of what the user population is infected with.
Statistics collected in a specific native trap (operated by Arcabit) are listed in the table shown below. The table shows that the user population is targeted with a wide range of different malware. The percentage of adware is surprisingly high, indicating that adware is very much an underrated problem.
| 2005.08 | 2005.09 | ||
|---|---|---|---|
| Trojan.Poebot.B | 8.73% | Trojan.Poebot.B | 16.09% |
| Trojan.Downloader.Dyfuca.Ei | 3.87% | Trojan.Poebot.D | 8.91% |
| Trojan.Lowzones.Hp.S02 | 3.85% | Trojan.Small.Hp | 7.12% |
| Trojan.Downloader.Agent.Tv | 3.74% | Adware.Elitetoolbar.A16 | 5.28% |
| Adware.180search.A31 | 3.26% | Adware.Elitetoolbar.A04.Etb.B2 | 5.15% |
| Trojan.Downloader.Istbar.Gen | 3.18% | Trojan.Rbot.Gen | 4.75% |
| Trojan.Dubar | 3.05% | Trojan.Small.Hp.A16 | 4.16% |
| Trojan.Downloader.Agent.Fx | 2.89% | Adware.Mediaticket.A16 | 4.16% |
| Adware.Mediagtw.A5 | 2.65% | Trojan.Small.Hp.A01 | 2.18% |
| Trojan.Roundstid.Hp | 2.55% | Trojan.Hwclk | 1.65% |
| Trojan.Downloader.Small.Asf | 2.55% | Adware.Betterinternet.A1 | 1.65% |
| Trojan.Nail.B5 | 2.28% | Trojan.Nanspy.E | 1.58% |
| Adware.Mediagtw.A1 | 2.20% | Trojan.Rbot.J18 | 1.45% |
| Adware.Mediaticket.S05 | 2.07% | Worm.Gaobot.Gen | 1.32% |
| Trojan.Downloader.Small.Gr | 2.04% | Trojan.Rbot | 1.19% |
| Trojan.Poebot.D | 1.96% | Adware.Elitetoolbar.A01.A2 | 1.12% |
| Trojan.Downloader.Vb.Jl | 1.96% | Adware.Elitetoolbar.A01.A1 | 1.12% |
| Adware.Elitetoolbar.S02 | 1.96% | Adware.Clientax.A16 | 1.12% |
| Trojan.Rbot.Hp | 1.94% | Trojan.Rbot.Hp.A02 | 1.06% |
| Adware.Bargainbuddy | 1.80% | Adware.Toolbar.Elitebar.Am | 1.06% |
| Other: | 41.44% | Other: | 27.90% |
Table 1. Statistics collected in a specific naming trap (operated by Arcabit).
While this is a very good approach to observing real-world threats, it is still limited in two respects. First, only malware specific to the installed OS version is collected, and secondly, this method does not take into account the active participation of users (such as web browsing, online chat, P2P file exchange, etc.).
It would be useful to carry out sampling on the users' computers. While this is performed by the support department of every AV company, the sample numbers are not high enough to draw any statistically significant conclusions.
At this year's AVAR conference researchers from Eset presented statistics collected using their ThreatSense.Net technology. They collect samples that are detected heuristically by their scanner. Obviously, this method is a very biased sampling – the question is can we draw (mostly) unbiased conclusions from it? If we ask the right questions, the answer is yes. According to the latest AV-Comparatives.Org, the NOD32 scanner is not particularly biased towards Trojans or worms. If we ask only if Trojans or worms are more prevalent on infected computers, then despite the biased sampling the result will be usable.
| Win32/TrojanDownloader.Swizzor | 43.68% |
| Win32/Dialer.HZ | 7.66% |
| Win32/Dialer.Q | 7.00% |
| Win32/Dialer | 4.61% |
| Win32/TrojanDownloader.INService | 4.54% |
| Win32/Adware.BetterInternet | 3.31% |
| Worm.RBot | 1.65% |
| Win32/TrojanDownloader.Dluca | 1.38% |
| Win32/Dialer.NAD | 1.04% |
| Win32/Adware.NdotNet | 0.87% |
The variant names are not of scientific use, but the fact that the majority of the incidents belong to Trojans or adware is another indicator that email worms (or even network worms) are not the biggest threats users face nowadays.
This conclusion is also supported by the long-term tendencies of the different Virus Patrol projects presented at VB2005 by Dmitry Gryaznov: non-replicating malware has taken over from viruses and worms on the Usenet. This does not necessarily indicate the infected state of the user population, but it is a good indication of what is being pushed to them via these additional distribution channels. Clearly, malware distributors are shifting towards Trojans – which can earn them more money than simply playing with self-spreading worms.
While it is not possible to find a single source for virus prevalence statistics, useful information can be obtained when statistics are combined from several sources as detailed here. Using all these pieces we still may not be able to put a single prevalence chart on our websites, but we will get a much better understanding of what bothers our users.
All these pieces point to the same conclusion: email worms are no longer the number one threat – non-replicating malware outweigh them in importance. There are positive tendencies though. The WildList has started to include bots, which brings the picture a little closer to reality. Hopefully, vendors will find a way to normalize their statistics to eliminate the over-representation of email worms. Then the press may actually get the real picture and start asking us about the latest terrible destructive adware program – but that will be a different problem.