2005-06-01
Abstract
In the first part of this article we inspected several problems that are encountered when particular objects are loaded into memory. In this part we will inspect further problems associated with static analysis techniques.
Copyright © 2005 Virus Bulletin
In the first part of this article (see VB, May 2005 p.12) we inspected several problems that are encountered when particular objects are loaded into memory. In this part we will inspect further problems associated with static analysis techniques. We assume that the object and accompanying libraries have been loaded successfully, and that we have our first disassembly ready.
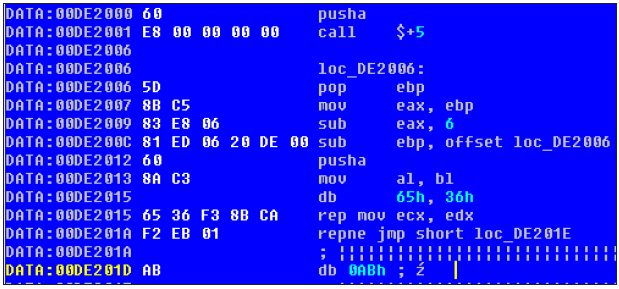
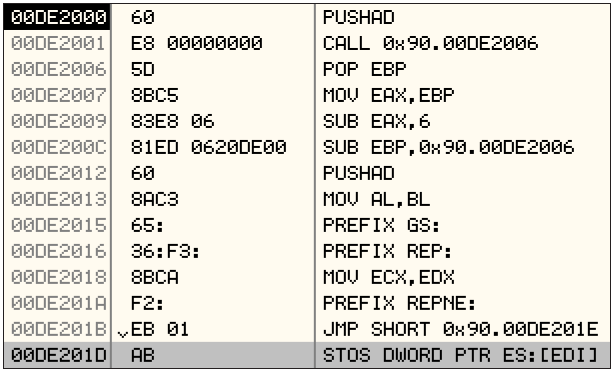
In the case of obfuscated code the first disassembly is usually far from perfect - even when using advanced tools such as IDA Pro or OllyDBG that analyse the code before providing the user with a code disassembly output. Figures 1 and 2 demonstrate a very simple code obfuscation technique based on prefixing instructions with segment registers and/or REP/REPNE opcodes. Inspection of the DE201A address reveals an interesting code structure: a jump opcode prefixed with REPNE opcode. The use of REP/REPNE prefixes can pose problems for static analysis tools: it is not possible in every case to guess the CPU state that would influence further program execution.
Take a look at the DE2015 address in Figure 1 and Figure 2 - IDA failed to disassemble this byte stream fully, while OllyDBG decided that the 65h opcode is the GS: prefix and disassembled the whole stream. This brings us to an important observation: different tools can disassemble the same code differently. In the real world things are a bit more complicated as most tools use different mnemonics for disassembly, which makes data exchange and data correlation even harder.

Use of GS:, REP: and REPNE: prefixes to obfuscate code during disassembly; this output was produced by IDA Pro after initial analysis.
Figure 1.

Use of GS:, REP: and REPNE: prefixes to obfuscate code during disassembly; this output was produced by OllyDBG during the debugging session of the same code.
Figure 2.
Why is this so important? Simply: if we create a tool that uses the disassembly listing as its input, then we probably cannot stop the disassembly process straight after the initial analysis. We first need to 'clean' the disassembly output. This is true both for normal compiler-generated code and for obfuscated code.
Another interesting case that readers can play with is the challenge described in [1] At the time of writing this article the solution to the challenge has not been published. I don't want to spoil the fun, so we will look only at the beginning of the file. When loading this object into the IDA disassembler, there is a warning that should ring alarm bells (see Figure 3).
Loading this file with OllyDBG provides us with another indication that the entry point is outside the code sections - the debugger issues this warning during file loading. Take a look at this snippet of the disassembly generated by IDA:
seg002:00407BD6 E9 25 E4 FF FF jmp loc_406000
[…]
seg002:00406000                                     loc_406000:
seg002:00406000                           60 pusha
seg002:00406001                           F8 clc
seg002:00406002                           E8 02 00 00 00 call near ptr
                                                                                        loc_406007+2
seg002:00406007                                                           loc_406007:
seg002:00406007                           E8 00 E8 00 00 call near ptr 41480Ch
seg002:0040600C                           db       0
seg002:0040600D                           db       0
seg002:0040600E                           db       5Eh ; ^
[…]
If we were to feed a static analysis tool with this disassembly it would generate the wrong results. The reason is the CALL instruction at the 406002 address. While IDA calculated the procedure address correctly (406007 + 2), it did not influence the code disassembly. If we count instruction bytes it is obvious that the first CALL instruction is calling procedures that start in the middle of another CALL at the 406007 address.
Now let's use IDA's interactive functionality to correct this disassembly. As a quick fix I converted the bytes at loc_406007 to data ('d' key), moved the cursor to the correct address (406007 + 2 =) 406009 and converted the bytes from that address to code ('c' key). (Note that this is not the correct method of fixing such disassembly problems in IDA. You should add cross-reference instead of just converting bytes to code.) Here is the result:
seg002:00406000 loc_406000:
seg002:00406000 60 pusha
seg002:00406001 F8 clc
seg002:00406002 E8 02 00 00 00 call loc_406009
seg002:00406007 E8 db 0E8h ;junk code
seg002:00406008 00 db 0
seg002:00406009 loc_406009:
seg002:00406009 E8 00 00 00 00 call $+5
seg002:0040600E 5E pop esi
seg002:0040600F 2B C9 sub ecx, ecx
seg002:00406011 58 pop eax
seg002:00406012 74 02 jz short near ptr
loc_406014+2
seg002:00406014
seg002:00406014 loc_406014:
seg002:00406014 CD 20 B9 51 19 00 VxDCall 1951B9h
seg002:0040601A 00 8B C1 F8 73 02 add [ebx+273F8C1h], cl
seg002:00406020 CD 20 83 C6 33 8D VxDJmp 8D334683h
At address 406012 we see a trick that is similar to the one described before, but this time instead of using CALL the author of this code used the JZ instruction. Also take a look at the 406014 address: the two bytes (CD20 = INT 20) that are skipped over were chosen wisely to make the disassembler think this is a VxD call. Of course it's the B9 51 19 00 bytes that really counts:
seg002:00406012 74 02 jz short loc_406016
seg002:00406014 CD db 0CDh ;INT 20 opcode
seg002:00406015 20 db 20h ;junk code
seg002:00406016 loc_406016:
seg002:00406016 B9 51 19 00 00 mov ecx, 1951h
The two code obfuscation techniques presented above are enough to demonstrate a whole set of problems associated with static analysis tools that use disassembly as their input. We need to do a lot of work on the disassembly listing before feeding it into another tool for further analysis.
Does this mean that we should disregard static analysis methods? Absolutely not. After all, we should remember the advantages of this approach, which include not needing to run code (and create processes and threads) and the ability to analyse code for different CPU architecture and operating systems.
Now it's time to solve our problems - at least partially.
We can strengthen our static analysis and disassembly process by adding full code emulation. This allows us to gain some advantages that previously were reserved for dynamic analysis tools like debugger. IDA seems to be a good target - after all it is a very powerful disassembler, which provides plug-in functionality through its SDK (note: IDA SDK is virtually undocumented, so your best bet is to analyse somebody else's plug-in code).
A perfect example of such an approach is the ida-x86emu plug-in by Chris Eagle [2] In [3] there is a discussion of how this tool was used successfully against UPX, Burneye and Shiva for example. Another reason to use ida-x86emu is the fact that this is an open source project, making this an excellent starting point for extending it.
It is worth noting that ida-x86emu not only works successfully against some code obfuscation techniques, but can also help in bypassing dynamic analysis protection. A good example is the use of the RDTSC instruction to measure execution time for a particular code snippet. If the code is single-stepped execution, time increases enormously and this is easy to detect. However, ida-x86emu emulates the RDTSC instruction and internal counters - take a look at its source code:
case 0x30: //
    if (opcode == 0x31) { //RDTSC
        edx = (dword) (tsc >> 32);
        eax = (dword) tsc;
    }
The tsc value is increased after every opcode emulation.
While working with ida-x86emu I decided that it would be convenient to have a current emulated line displayed in the x86emu window just like register values and stack. This proved to be a nice exercise in understanding how IDA internals really work. Because ida-x86emu emulates the CPU it is not really interested in the line number but in the current position in terms of code. This is kept in ea_t (line address of instruction). The loc variable of type ea_t is initialized according to the eip variable, which reflects the EIP register value.
To obtain the filled cmd structure which holds the internal instruction representation (IDA internal representation of the instruction is different from the instruction opcode value) I used the ua_ana0() function. To get the disassembly line that IDA generates I needed two more functions:
generate_disasm_line(eip, opstr, sizeof(opstr),0); - generates one line of disassembly from code at eip location
tag_remove(opstr, opstr, sizeof(opstr)); - removes additional tags from disassembly line so it can be easily displayed in static text control
The rest of the modifications are simple Win32 API functions used to display the text in the plug-in window.
While extending the ida-x86emu plug-in I also wanted to be able at a later point to use some kind of metaprocessor over the disassembled code. I could, of course, save the results to a text file after running the emulator over it. However, all the pieces of the metaprocessor are already in this plug-in and I wanted to show how easy it could be to write one using existing tools.
Before we delve further into technical aspects I should define the metaprocessor term. In our case the metaprocessor is not working on real CPU instruction - instead it works on an abstract view of emulated/ disassembled code. This allows us to work only on relevant code sections like the analysis of flow control. A similar technique is used, for example, in a binary comparison based on graphs [4]. An important feature of the metaprocessor is the fact that the same metaprocessor can be used for different CPU architectures. The only difference is a code that translates real opcode sets into abstract instructions.
A very simple metaprocessor is presented in [5]. The approach described in [5] is interesting as the whole solution has been developed in Perl and is based on objdump for providing input disassembly. A similar simple tool developed in Python with the help of dumpbin is demonstrated in [6] as a proof of concept. In fact, Perl, Ruby and Python are very well suited as environments for developing metaprocessors based on externally generated disassembly in text format.
Extending ida-x86emu in order to perform additional analysis with an external metaprocessor developed in one of these scripting languages is a fairly trivial task. For simplicity I decided to use the IDA output window. The msg() function from SDK allows us to output the string in this window. Later the metaprocessor can be fed with the result from the IDA output window. To make parsing of the result from the output window easier it is a good idea to add some prefixes (such as inst:) before the metaprocessor instruction.
The object of this two-part series was to present different obfuscation and anti-analysis techniques and illustrate their impact on the static analysis of binary objects. While we worked on Windows PE files, most of the techniques could be used in the Unix world as well. The difference lies in the executable file format (ELF or A.OUT) and system loader internals and the fact that Unix/Linux systems lack great tools such as OllyDBG and SoftICE to mention just a couple.
It seems that static analysis backed up by metaprocessor, graph analysis and code emulation is a very powerful combination technique, which can greatly automate the disassembly of obfuscated code. Further development of these methods will allow not only better malware analysis but also vulnerability detection in binary objects and powerful binary comparison.
[2] ida-x86emu: http://ida-x86emu.sourceforge.net/..
[3] Chris Eagle, 'idax86emu x86 Emulator Plugin for IDA Pro', CODECon 2004 http://ida-x86emu.sourceforge.net/codecon04.pdf.
[4] Halvar Flake, 'Structural Comparison of Executable Objects', http://www.sabre-security.com/files/dimva_paper2.pdf.
[5] Cyrus Peikari, Anton Chuvakin, Security Warrior, O'Reilly, January 2004, ISBN 0-596-00545-8; http://www.oreilly.com/catalog/swarrior/.